![[Experimental]](figures/lifecycle-experimental.svg)
Produce an alternative graphic representation of AE, counting AE as bars for each patient, colored by grade. Can be faceted by treatment arm.
Usage
ae_plot_grade_sum(
  data_ae,
  ...,
  data_pat,
  low = "#ffc425",
  high = "#d11141",
  weights = NULL,
  arm = NULL,
  grade = "AEGR",
  subjid = "SUBJID"
)
Arguments
- data_ae
adverse event dataset, one row per AE, containing
subjid,grade,group1, and potentiallygroup2.- ...
unused
- data_pat
enrollment dataset, one row per patient, containing
subjid(andarmif needed). All patients should be in this dataset.- low
the color of Grade 1 AE
- high
the color of Grade 5 AE
- weights
(optional) a length 5 numeric vector, giving the weights of each grade
- arm
name of the treatment column in
data_pat. Case-insensitive. Can be set toNULL.- grade
name of the AE grade column in
data_ae. Case-insensitive.- subjid
name of the patient ID in both
data_aeanddata_pat. Case-insensitive.
See also
ae_table_grade(), ae_table_soc(), ae_plot_grade(), ae_plot_grade_sum(), butterfly_plot()
Examples
tm = grstat_example()
attach(tm, warn.conflicts=FALSE)
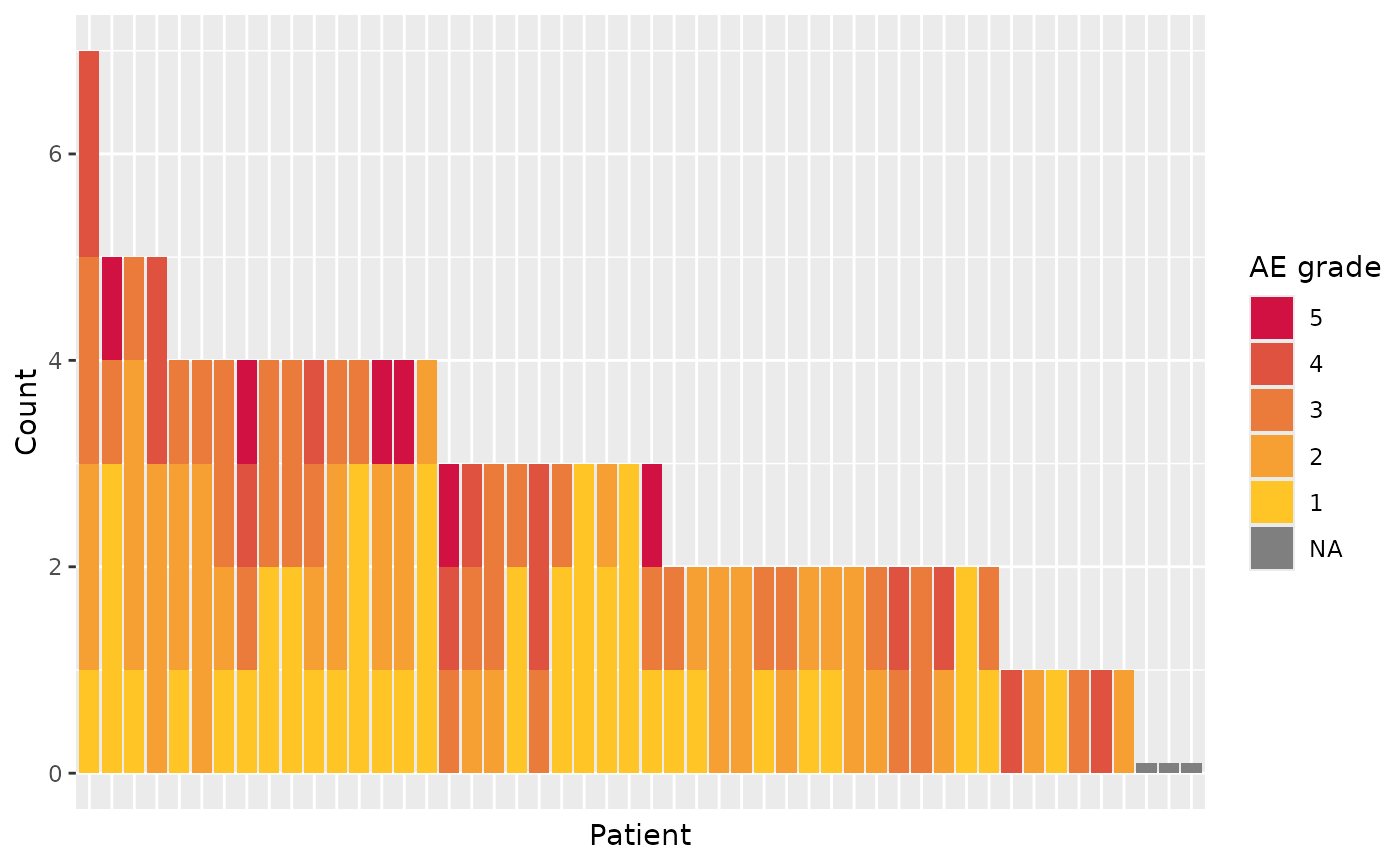
ae_plot_grade_sum(data_ae=ae, data_pat=enrolres)
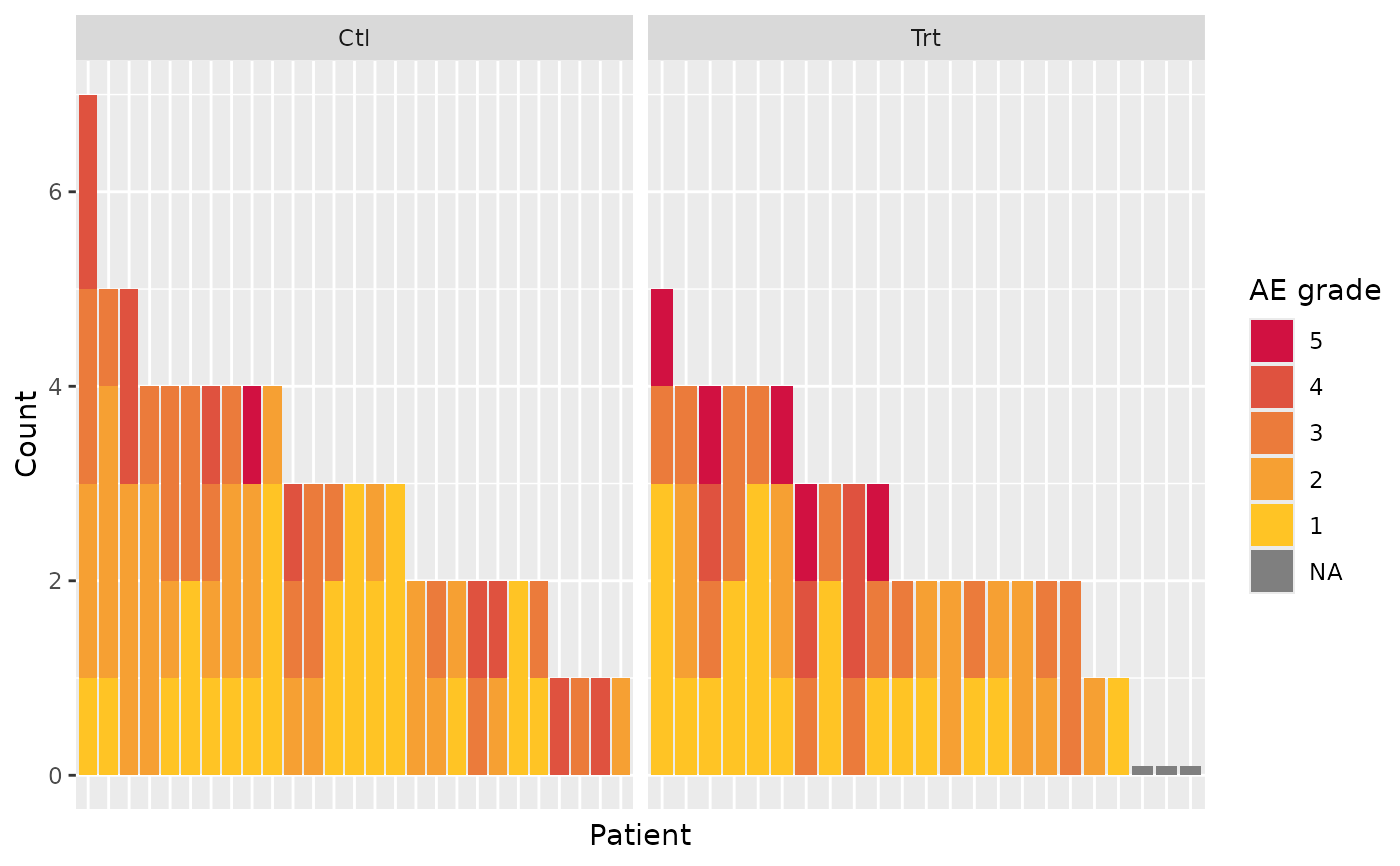
 ae_plot_grade_sum(data_ae=ae, data_pat=enrolres, arm="ARM")
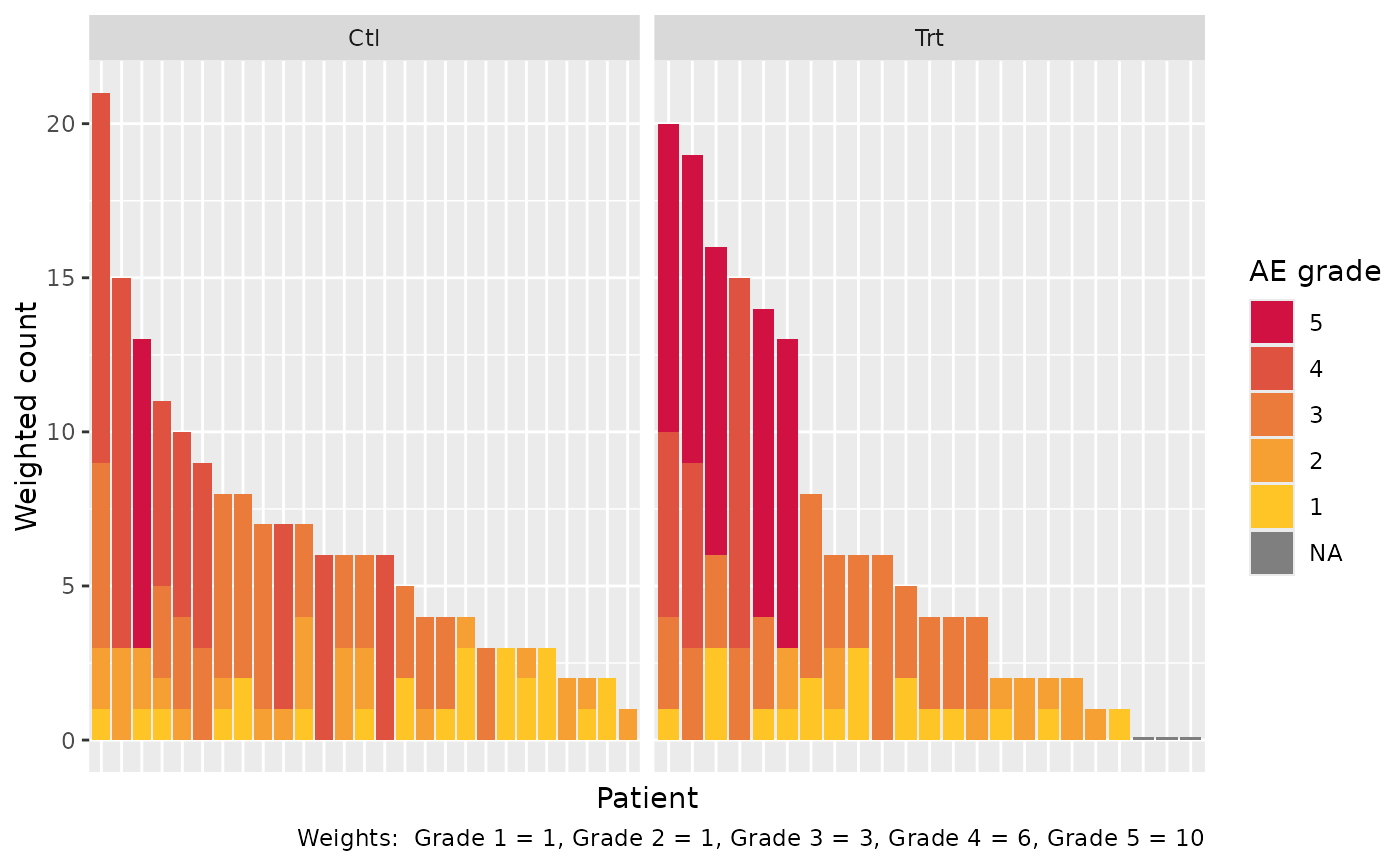
 ae_plot_grade_sum(data_ae=ae, data_pat=enrolres, arm="ARM", weights=c(1,1,3,6,10))