![[Stable]](figures/lifecycle-stable.svg)
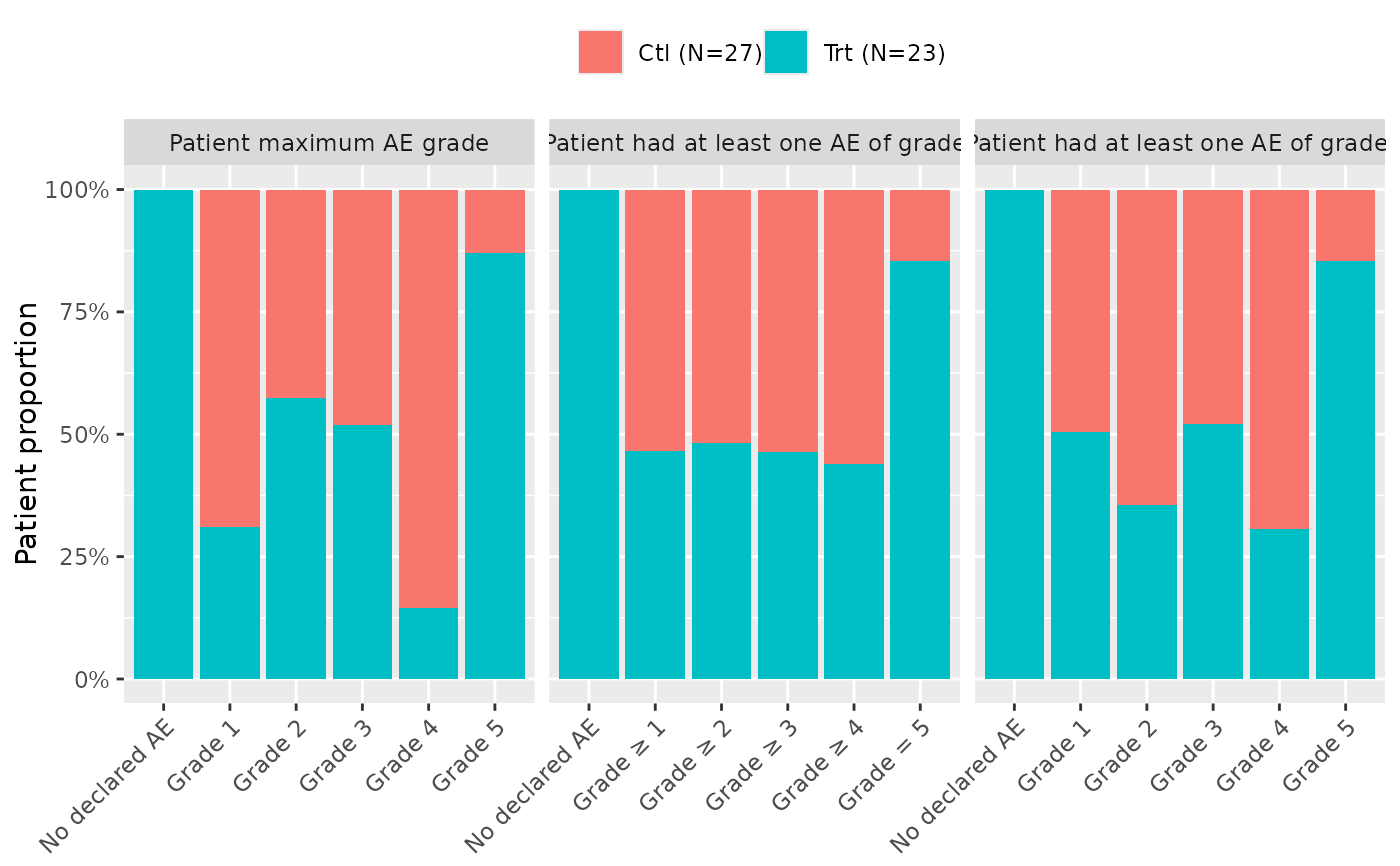
Produce a graphic representation of AE, counting AE as bars for each patient, colored by grade. Can be faceted by treatment arm.
Arguments
- data_ae
Data frame of adverse events, with one row per AE.
- ...
Unused.
- data_pat
Data frame of enrolled patients, with one row per patient.
- measure
Character vector specifying which variants to compute:
"max","sup","eq".- position
Position adjustment (cf.
ggplot2::geom_col())- type
whether to present patients as proportions (
relative) or as counts (absolute)- arm
Name of the arm column in
data_pat. IfNULL, all patients are pooled.- grade
Name of the AE grade column in
data_ae.- subjid
Name of the subject ID column (in both data frames).
- total
Logical. If
TRUE, adds a "Total" column across arms (only if multiple arms exist).- na_strategy
A named list controlling how missing AEs or absent patients are displayed in the output tables. Must contain
display(one of"if_any"or"always") andgrouped(logical).
Examples
tm = grstat_example()
attach(tm, warn.conflicts=FALSE)
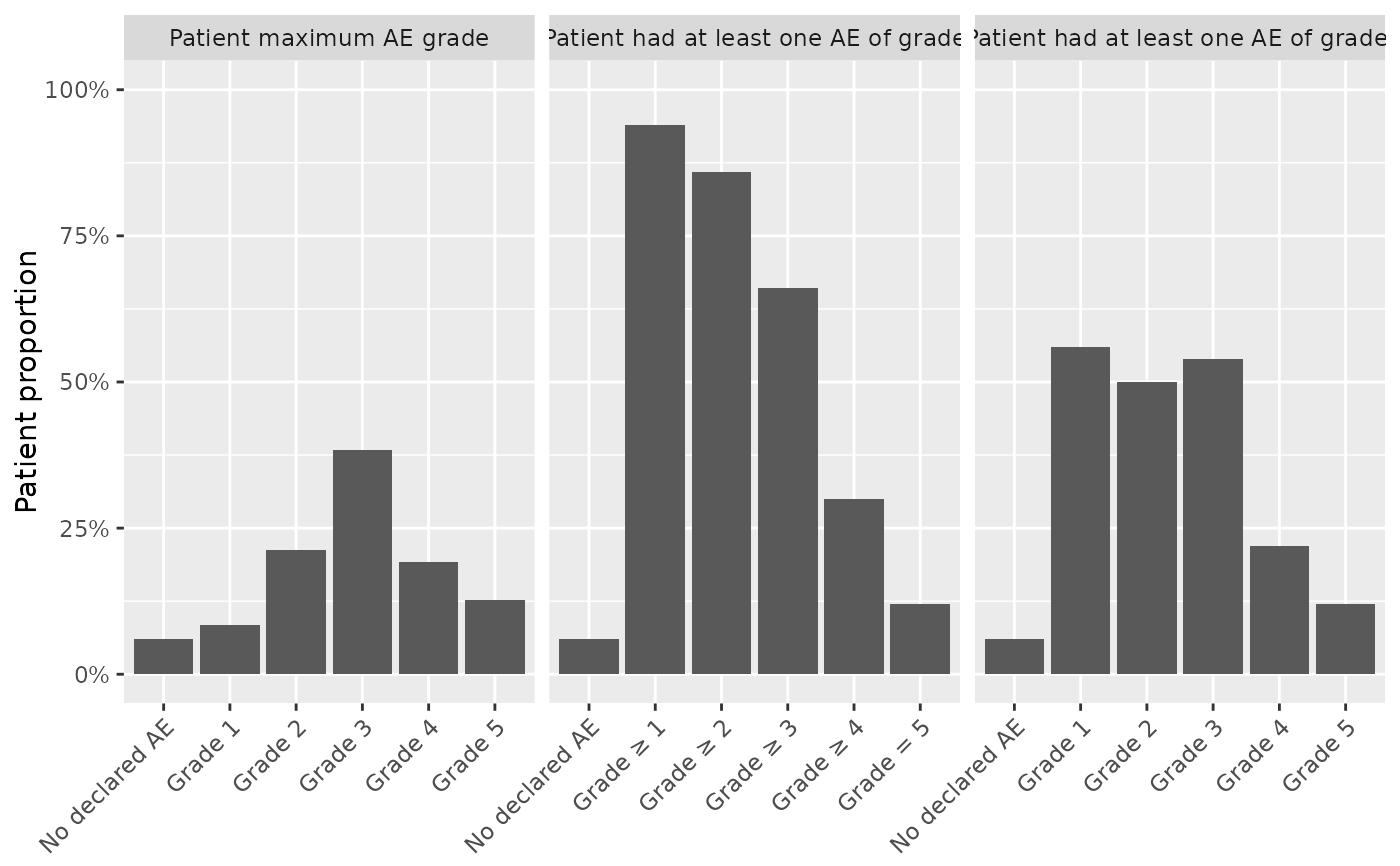
ae_plot_grade(data_ae=ae, data_pat=enrolres)
 ae_plot_grade(data_ae=ae, data_pat=enrolres, arm="ARM", measure=c("sup", "max"))
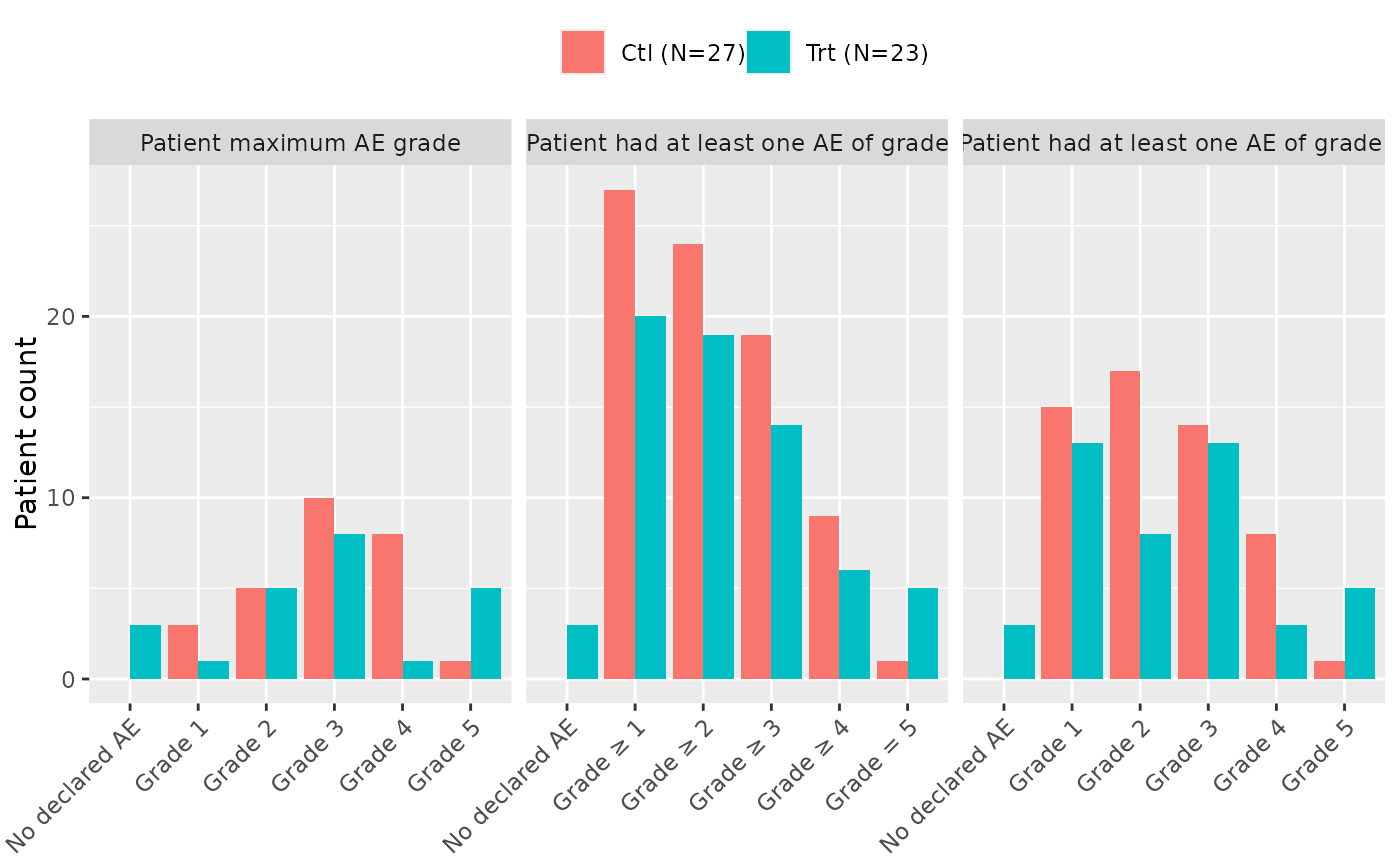
 ae_plot_grade(data_ae=ae, data_pat=enrolres, arm="ARM", type="absolute")
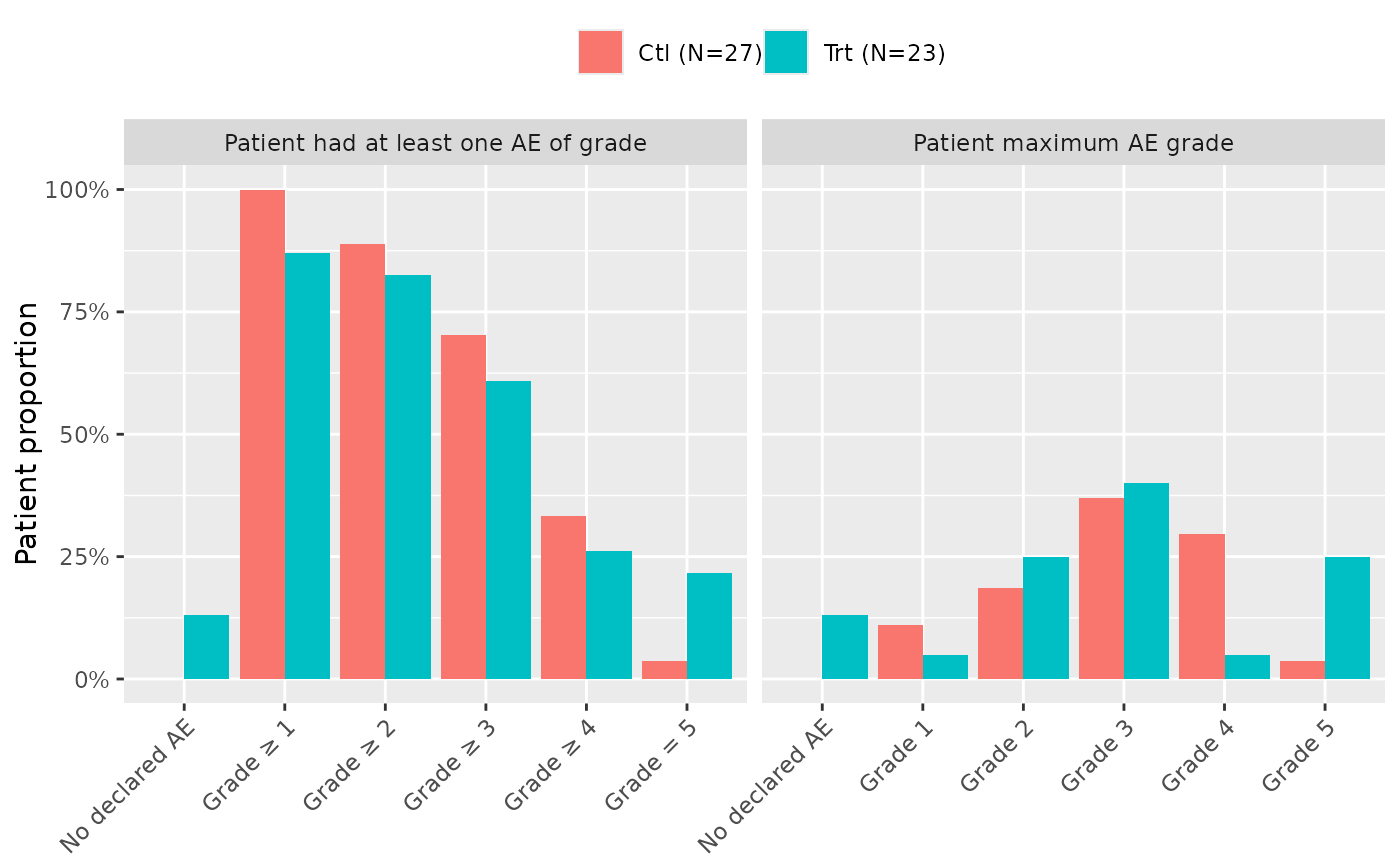
 ae_plot_grade(data_ae=ae, data_pat=enrolres, arm="ARM", position="fill")
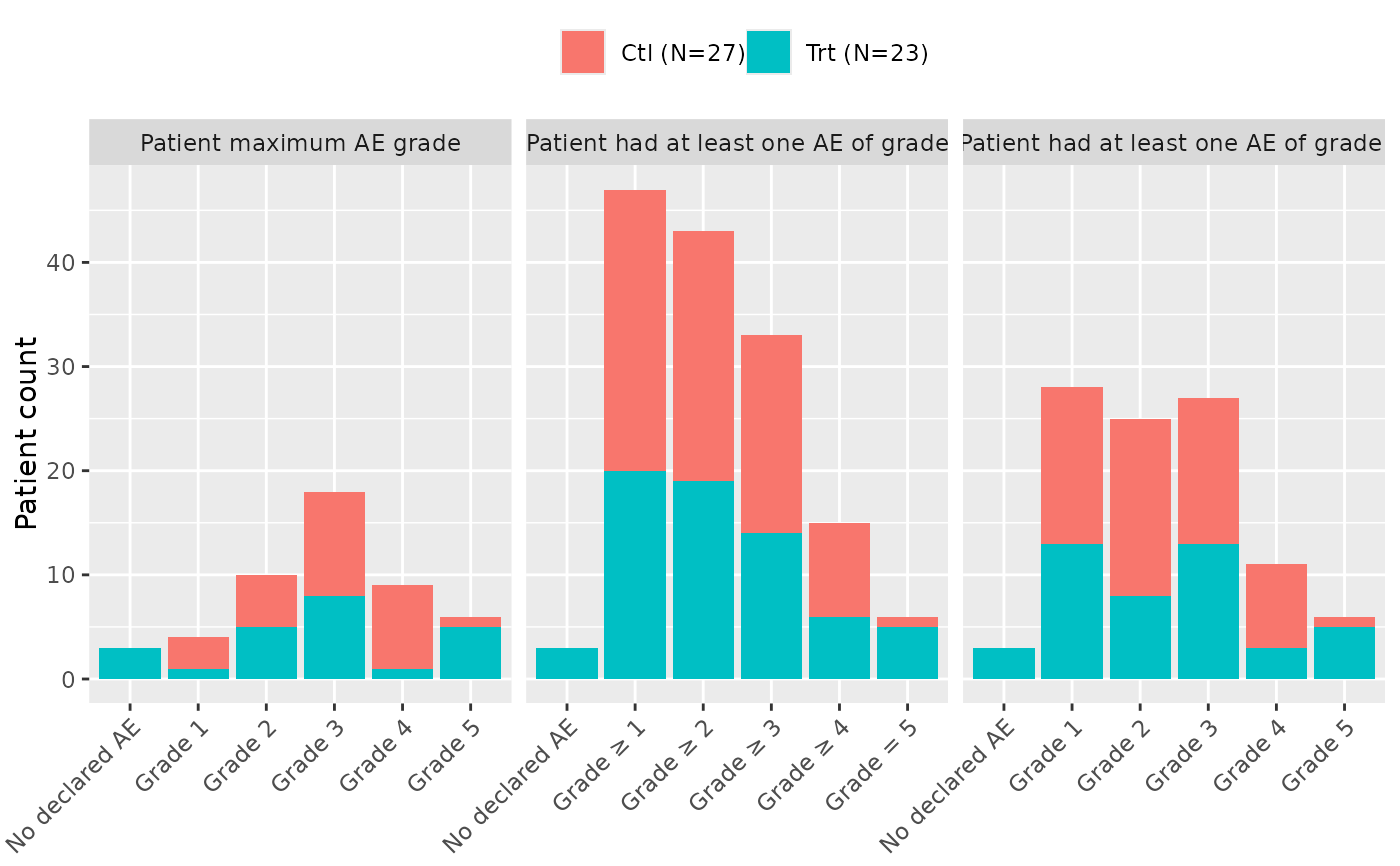
 ae_plot_grade(data_ae=ae, data_pat=enrolres, arm="ARM", position="stack", type="absolute")